Pakistan: An Analytical Trajectory Report (2018–2025)
1. Security Forces Casualties and Internal Security
The security landscape witnessed a dramatic downturn starting in late 2022. The period 2023–2025 has been characterized by kinetic operations and defensive posturing, contrasting with the negotiation and fencing focus of the 2018–2022 era.
Comparative Casualty Trends (Security Forces & Total Violence)
Visualizing the Violence Surge: Average Annual Total Fatalities
(Comparing the 2018-2021 baseline vs. the 2023-2025 escalation. Data combines civilians, security forces, and militants.)
| Period/Year | Security Force Fatalities | Total Fatalities (All actors)* | Key Driver |
|---|---|---|---|
| 2018–2021 (Avg) | ~180 / year | ~800 / year | Relative stability; Border fencing. |
| 2022 | ~282 | ~980 | TTP ceasefire breakdown (late 2022). |
| 2023 | ~500+ | 1,500+ | Post-Kabul fall blowback; TTP resurgence. |
| 2024 (Full Year) | ~600+ | ~2,500 | Intensified attacks on police/infrastructure. |
| 2025 (YTD Dec 24) | **~750+** | **3,100+** | Highest violence level since 2014. |
*Total fatalities include civilians, security personnel, and militants. Sources based on CRSS/PIPS data methodology.
Regional Breakdown and Strategy (2024–2025)
- Khyber Pakhtunkhwa (KP): The epicenter of violence, accounting for approximately **65%** of all terror-related fatalities in 2025. Police stations in southern KP became primary targets for night-vision equipped militant sniper attacks.
- Balochistan: accounted for **~30%** of fatalities. The threat matrix here remains distinct, involving Baloch separatist groups (BLA/BLF) targeting CPEC infrastructure and security convoys.
- Operational Shift: The 2023–2025 period saw security forces moving from a "holding" posture to reactive Intelligence-Based Operations (IBOs). Intelligence failures were noted in the inability to predict large-scale complex attacks on fortified compounds in Bannu and Chitral.
4. Migration, Brain Drain, and Human Capital Flight
The period between 2022 and 2025 witnessed the largest sustained wave of emigration in Pakistan's history, driven by a collapse in economic confidence and physical insecurity.
Visualizing the Exodus: Registered Workers Abroad (Annual)
Source Data: Bureau of Emigration & Overseas Employment (BE&OE). Note: These figures only represent workers registered through official channels. Total migration including students and irregular avenues is significantly higher.
Analysis of "Brain Drain"
- Total Outflow (2018–2025): Over **4.5 million** Pakistanis left officially for employment.
- The Quality Shift: While laborers make up the bulk, the 2022–2025 wave included a disproportionate percentage of highly skilled professionals. In 2024 alone, reports indicated over 5,000 doctors and thousands of IT engineers left the country.
- Drivers: The pre-2022 era migration was largely driven by "pull factors" (better wages abroad). The post-2022 era is overwhelmingly driven by "push factors" (hyperinflation, energy crisis, and lack of future prospects).
5 & 6. Business Climate, Capital Flight, and Industrial Decline
Investor confidence collapsed post-2022 due to extreme policy volatility, prohibitive energy costs, and difficulties in repatriating dollar profits. This led to the exit of long-standing multinational corporations and a crisis in the domestic textile sector.
Infographic Timeline: Major Corporate Exits & Shocks (2022–2025)
Various MNCs report inability to repatriate dividends due to dollar shortage. Confidence begins to erode.
Shell announces exit from Pakistan after 75 years, selling its stake due to economic uncertainty and currency volatility.
Telenor Group agrees to sell its Pakistan unit to PTCL, citing the difficult business environment and high cost of operations.
Careem and Uber significantly scale back or cease certain services. Several international software houses relocate regional HQs to Dubai.
APTMA reports closure of approx. 30-40% of spinning capacity due to energy tariffs reaching 16-18 cents/kWh (uncompetitive regionally).
9. Comparative Summary and Trajectory Assessment
| Metric | Imran Khan Era (2018–April 2022) | Post-Imran Era (April 2022–Dec 2025) | Trajectory Trend |
|---|---|---|---|
| Internal Security | Relative calm; Fencing focused; TTP negotiations attempted. | TTP resurgence; Kinetic operations; High casualty rates in KP/Balochistan. | Deterioration |
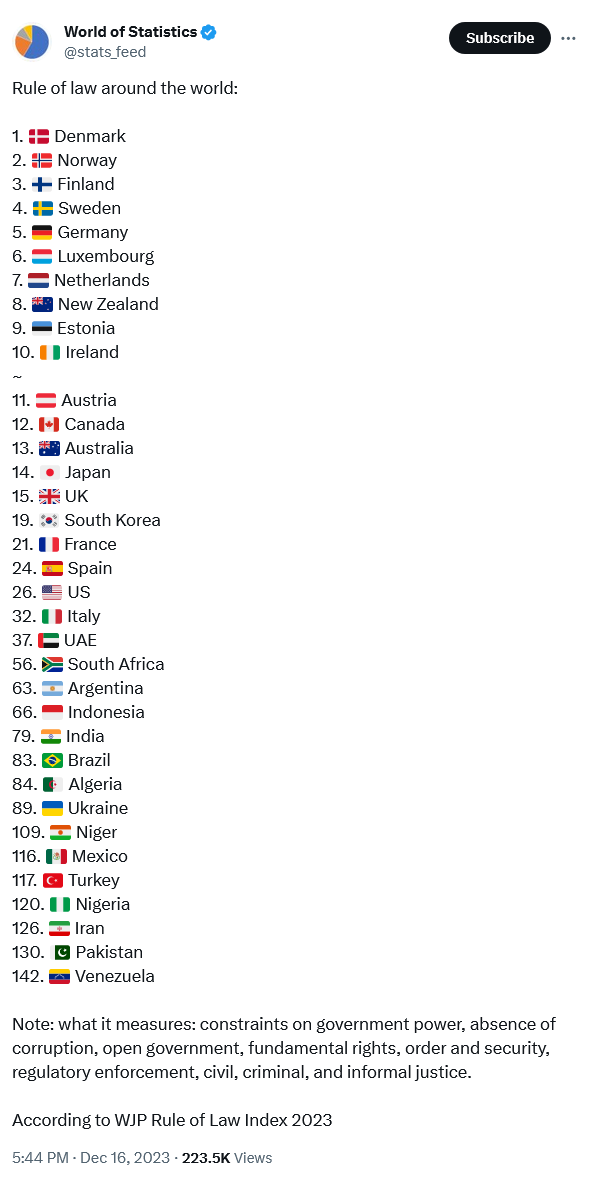
| Terrorism Index Rank | Improved rankings (moving away from top 5). | Re-entered top 5 worst-affected globally (2024/25 GTI). | Negative |
| Migration (Annual) | Average ~300k–400k registered workers. | Historic spikes (~700k–800k); High brain drain. | Mass Exodus |
| Business Climate | Volatile but functional; Record textile exports (2021). | Capital flight; Major MNC exits (Shell, Telenor); Industrial closures. | Collapse |
| International Perception | Mixed; FATF Grey List struggles (eventually cleared). | Viewed as high-risk/fragile; Heavy reliance on IMF bailouts to avoid default. | Fragile |
Conclusion and Outlook
As of December 2025, Pakistan is trapped in a **low-growth, high-violence equilibrium**. The trends established between 2023 and 2025 indicate structural damage rather than temporary cyclical downturns. The simultaneous erosion of state authority in border regions and the collapse of the formal industrial tax base create a negative feedback loop that is difficult to reverse in the short term.
Forward Risk (2026): The primary risk is the further consolidation of militant safe havens in KP, coupled with an economic inability to fund the necessary sustained counter-insurgency operations due to shrinking fiscal space.